Integrating qualitative and quantitative data analysis with Bellomy AI Analytics for Text
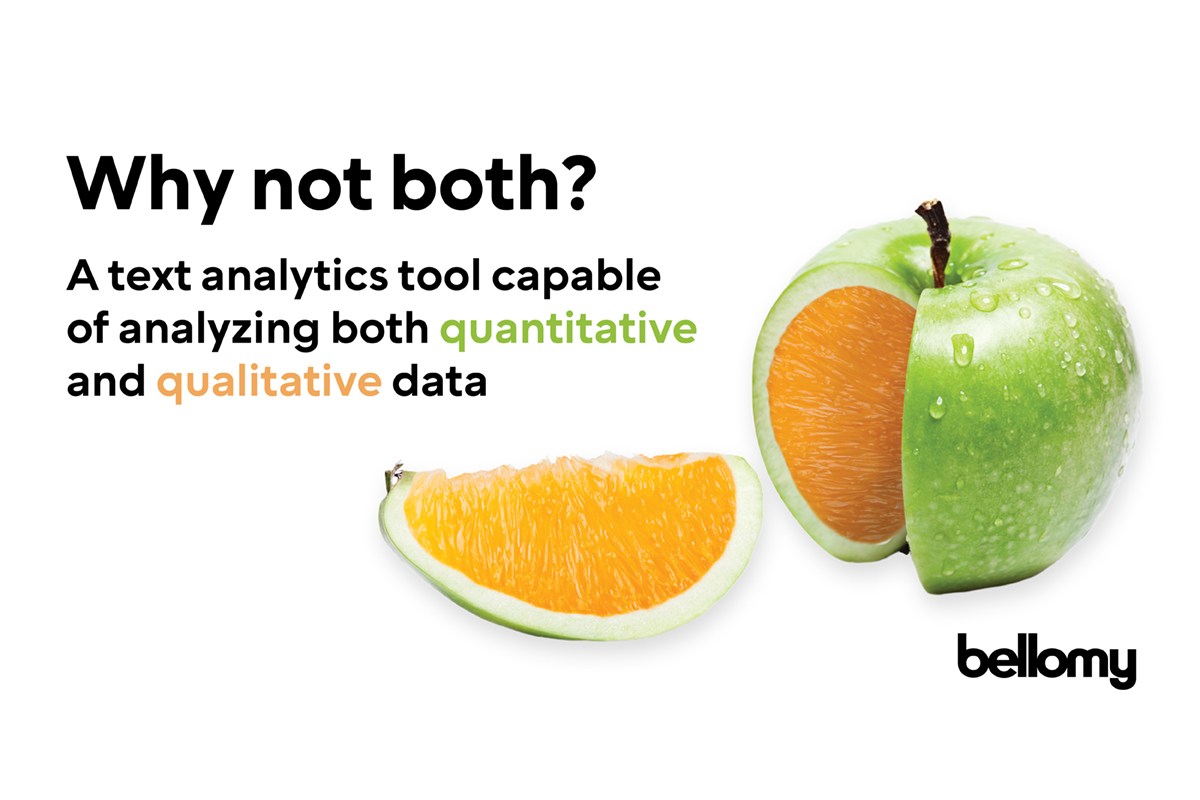
In the world of market research, the pursuit of innovative tools to analyze data is relentless. Traditionally, quantitative and qualitative methods have been considered distinct approaches to gather insights. However, a persistent need exists within the research community to integrate these two data types. Researchers strive to merge qualitative and quantitative findings to grasp a full picture of customer experience and voice-of-customer data — an orchestrated blend of “what” and “why.”
Bellomy AI Analytics for Text stands out in this area. Before the Bellomy Insights Technology team developed our tool, we were in the same position as many research companies and brands. We needed a tool that, among other things, could help us merge qualitative and quantitative data for analysis. We went through the “buy vs. build” process many companies do when considering technology tools, and after an extensive search we hadn’t found any insights technology tools to fit our needs. Knowing what we needed, and having the development capabilities combined with our team of researchers helping to inform the process, we built our own tool with this ability. Unlike the conventional market research tools we tried, Bellomy AI Analytics for Text boasts the ability to analyze qualitative and quantitative data concurrently. This capability goes beyond mere number crunching or text mining; it's about quickly and accurately weaving together the complex narratives that can come from the combined analysis of these data types.
 Why the simultaneous analysis of quantitative and qualitative data matters
Today, aligning qualitative insights with quantitative data can lead to a paradigm shift in comprehending customer behavior. Quantitative data lays out the "what" — numerical measurements ripe for statistical analysis that furnish us with objective facts about consumer habits. Many companies have whole teams of data managers and analysts providing ways to democratize data in their organizations, which is a never-ending process, it seems. On the flip side, qualitative data unravels the "why" — detailed, narrative-rich content that delves deep into consumer sentiments and perceptions. I have heard many times from researchers that a vast majority of their qualitative data goes unanalyzed.
The magic of merging these data types is their collective strength in painting a vivid picture of the customer experience — the precision of quantitative facts married to the nuanced context of qualitative understanding, giving you the ability to weave the narrative your organization’s stakeholders need.
Imagine the ability to extract topics governed by hyper-specific variables such as geography, income, and demographic details. Picture, for instance, how a product resonates with Gen Z females in New York City within a particular income range. What are their priority concerns according to their feedback? Brand loyalty for some demographics hinges on a personalized purchase experience. This level of detail empowers more accurate targeting and bespoke marketing initiatives, leading to informed organizational decision-making based on insights from research professionals that have the power to bring together the “what” and the “why” to better tell that story.
Bellomy’s AI Analytics for Text software leads the way in this revolutionary approach
It’s not about simply crunching numbers or mining text, but about understanding the cohesive story these two types of data can tell when analyzed together. From conversations on industry webinars and in-person events, that is what researchers want and need.
Our tool allows users to easily identify themes and patterns within your data and quickly gauge their importance through quantitative measures. This potent combination of “what” and “why” offers a 360-degree view of your customer’s journey, enabling you to make more informed decisions, develop more effective strategies and ultimately foster stronger connections with your customers.
The Bellomy tool's distinctive features
AI Assistant
Bellomy AI Analytics for Text introduces the AI Assistant, an interactive(generative) experience where you can dig deeper into your data with the power of a safe and secure AI. Choose topics (or the entire dataset) and prompt the AI to provide answers to specific questions. Default prompts probe for top themes overall, top positive and negative themes, and offer executive summaries. A customizable option also allows you to pose unique questions, honing your prompting skills.
But how can we guide an AI to focus on specific data for nuanced responses? We harness the power of selecting a quantitative variable for the AI to concentrate on. For instance, imagine we have a dataset of pizza chain reviews pulled from Google. Everyone can relate to a pizza meal experience, right?. Our automated Ai generated topic model returned back “Food quality and taste” as the top topic, based on frequency of mentions. I want to find a quick way to ask the AI Assistant to tell me the difference between two chains we’ll call Pizza Palace and Daddy Joe’s for this topic.
I could ask the AI to look across the whole of the dataset. The response that comes back is very helpful. But I have a pretty specific question about a quantitative variable in the data. I want the AI to go really deep into considering that variable when it answers my question. So I prompt our AI Assistant with the following question: “Explain to me the differences between Pizza Palace and Daddy Joe’s when it comes to food quality and taste.” I then select the “brand” quantitative variable that came in with the data. Then the AI went and looked at the question and took into mind that I wanted it to focus on the brand variable to get really specific about how it returned an answer to me. The result? The AI Assistant understood that while some people had positive reviews of Pizza Palace, more people commented about issues of lukewarm pizza and not enough sauce on the wings. The AI Assistant then talked about the reviews for Daddy Joe’s being predominantly positive, with reviewers saying their pizza was hot and fresh, indicating more consistent food quality. The AI Assistant zeroed in on just the two brands specified in the prompt by selecting that “brand” variable and gave a specific, more nuanced response.
Crosstabulation
Another way to analyze quantitative and qualitative data in the same place (included with Bellomy AI Analytics for Text) is a crosstabulation feature. Our researchers had a need to integrate the findings from the AI Analytics for Text tool’s created topics and view them in a more traditional, crosstabulated format. Continuing with our pizza chain example, I want to look back at the topic of food quality and taste. But I want to then see the percentage of responses for that topic for our same two chains using a quantitative variable of geography and look at the state of California.
With a few clicks, I see for the “food quality and taste” topic in California that Daddy Joe’s had 67 (out of 205 total, or 22.7%) vs. 181 (out of 775 total, or 23.4%) for Pizza Palace. Assuming I pulled all available reviews from that region, I could then drill down to cities if I wanted to find more specific nuanced information. When you apply this thinking to other quantitative variables, you start to see the power of analyzing qual and quant together.
Impact Scoring
The Bellomy AI Analytics tool is set up to calculate the quantitative variable of scoring and line them up with qualitative data elements that are defined topics. Imagine calculating a qualitative topic and using the scoring metric from reviews (net promoter score, overall satisfaction, Google 5-star reviews, etc.) and finding out what topics, when mentioned, impact those scores positively or negatively. If I have a high number of comments about a given topic but it isn’t making much of an impact on my scoring, is that the highest priority for me to focus on as a researcher? Sometimes having fewer comments about a topic is more valuable when we see how it impacts scoring, especially when the impact is negative. For an example, let’s return to our pizza data. When I select “impact” and look for the highest positively impacted topics, it shows me “staff appreciation.” I get a +5.31 on my scores when someone mentions something related to staff appreciation. The catch is that it’s only 15% of overall comments where this is the case. It’s not the most mentioned, but when it is, it has the highest positive impact. This is the kind of information it's important to share with business stakeholders.
On the other end of the spectrum, the topic with the highest negative impact is “order accuracy and modifications.” This comprises a whopping 41% of all the comments, and when reviews fall into this assigned topic, the result is a -5.85 to ratings. Discovering what has the most positive and negative impact highlights another benefit of the tool’s ability to analyze elements of qualitative and quantitative data together.
The ability to sculpt meaningful narratives from an ocean of data becomes more challenging and more important every day
Embracing innovative tools that allow for simultaneous analysis of qualitative and quantitative data can help put you on the path to spending less time answering questions (and pouring through mountains of data) and more time thinking critically and providing the best direction to your organization.


